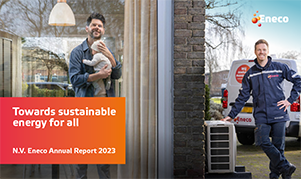
Towards sustainable energy for all
Eneco is a leader in the energy transition and will therefore be climate neutral by 2035. We are well on track in achieving our challenging objectives.

Towards sustainable energy for all
We spent the last financial year again working hard to supply our customers with affordable, reliable and sustainable energy. Our continued efforts to develop sustainable production will make the country’s energy system less dependent on fossil fuels from abroad, and also less vulnerable.
Read the Foreword2023 in brief
Assets

Production
Managed sustainable electricity production
17,696 GWh
Belgium
4,150 GWhGermany
1,998 GWhNetherlands
10,582 GWhUnited Kingdom
966 GWh
Heat
Total installed sustainable capacity
216 MWth

Installed capacity
Total installed sustainable capacity in ownership
2,178 MWe
Belgium
629 MWeGermany
52 MWeNetherlands
1,281 MWeUnited Kingdom
216 MWe
Realising and managing assets
Taking CrossWind/ Hollandse Kust Noord offshore wind farm into operation; Developing Ecowende offshore wind farm proceeding on schedule.
Customers

Introduction of Eneco Dynamisch:
where customers follow the daily market prices for electricity and gas.

Temporary Energy Emergency Fund:
Thanks to the combined efforts of Eneco, other energy suppliers, societal organisations and the government, last winter eligible customers could again claim financial relief on their energy bills under the Temporary Energy Emergency Fund

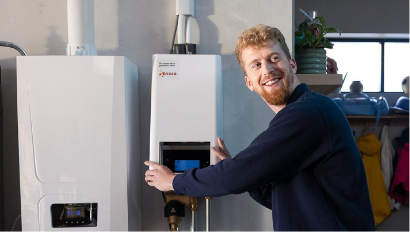
Growing the installed base of hybrid heat pumps:
including the introduction of a pump rental proposition.

Introduction of Eneco SlimLaden
to help our customers to cut their energy costs by charging their electric vehicles at lower rates during off-peak hours.
Integration

Development of our own Virtual Power Plant (VPP)
At present we can control around 4,000 MW worth of assets from our trading floor in real time through our Virtual Power Plant Myriad.

Investment in the Battery Energy Storage System (BESS)
The system will be realised in Ville-sur-Haine in Belgium, with 53 Tesla battery units providing a total of 200 MWh in storage capacity.
First battery system for a business customer at Oegema Transport
The energy from the battery is used both locally and on energy markets to improve the balance in the electricity grid.

Corporate Power Purchase Agreements (cPPAs)
Almost the entire future production of the Ecowende wind farm has been sold to large business customers in the Netherlands, such as Albert Heijn, KPN and Google under cPPAs.
2023 in brief

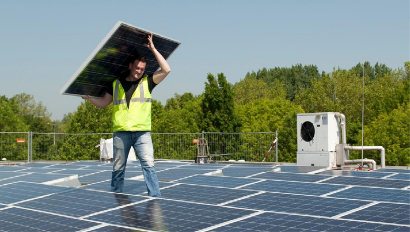
Wind

Solar

Heat

Other
Eneco is an integrated energy company with operations in the entire supply chain: producing electricity and heat, trading, and selling electricity, gas, heat and related services to consumers and business customers. We operate in four markets in Northwestern Europe: the Netherlands, Belgium, Germany and the UK. We are headquartered in Rotterdam. Our two shareholders are Mitsubishi Corporation and Chubu Electric Power.
View the map
Outlined results
-
These key figures cover the reporting period from 1 January to 31 December 2023, to reduce the need for estimates and to allow for better reconciliation with the mandatory reports.
-
In 2035, approx. 0,9 Mtons of CO2 emissions will be neutralised.
-
All figures marked “12m Mar 2023” are unaudited pro forma figures.
-
An amount of €16 million was reclassified from cash flows from operating activities to cash flows from financing activities.
-
The Interest Coverage Rate is the operating result (EBIT) divided by the financial expense.
-
The ROACE for the reporting period reflects how (EBIT plus income from JVs and associates, less corporate income tax) relates to the average of (fixed assets plus adjusted net working capital, less non-interestbearing long-term debt at the balance sheet dates).
-
These ratios have been measured and compared over a period of 12 months
Our value
Every day, we put our passion into working with our customers and our partners to make a difference. Our values play a vital role here. The first of those values, 'Drive the change', highlights our clear vision for the future and our decision to act now. ‘Deliver the plan’ means that everyone should have an impact and realise their goals. 'Make each other successful' reflects how much weight we give to safe, inclusive and constructive teamwork along the entire value chain.